Three ways of sending your transactions
- A file, dropped in “Data import”: with no development at all, for monitoring after the fact.
- A view of your database, read by YARDA at regular intervals: near real time with no development.
- The API, called by your system for each transaction: the only way to stop a transaction before it is executed.
The ways open to you depend on your organisation’s plan: file import, database connectors and the real-time API are not included in every plan. When one is not, the console says so on the page concerned.
Importing a file with Connect
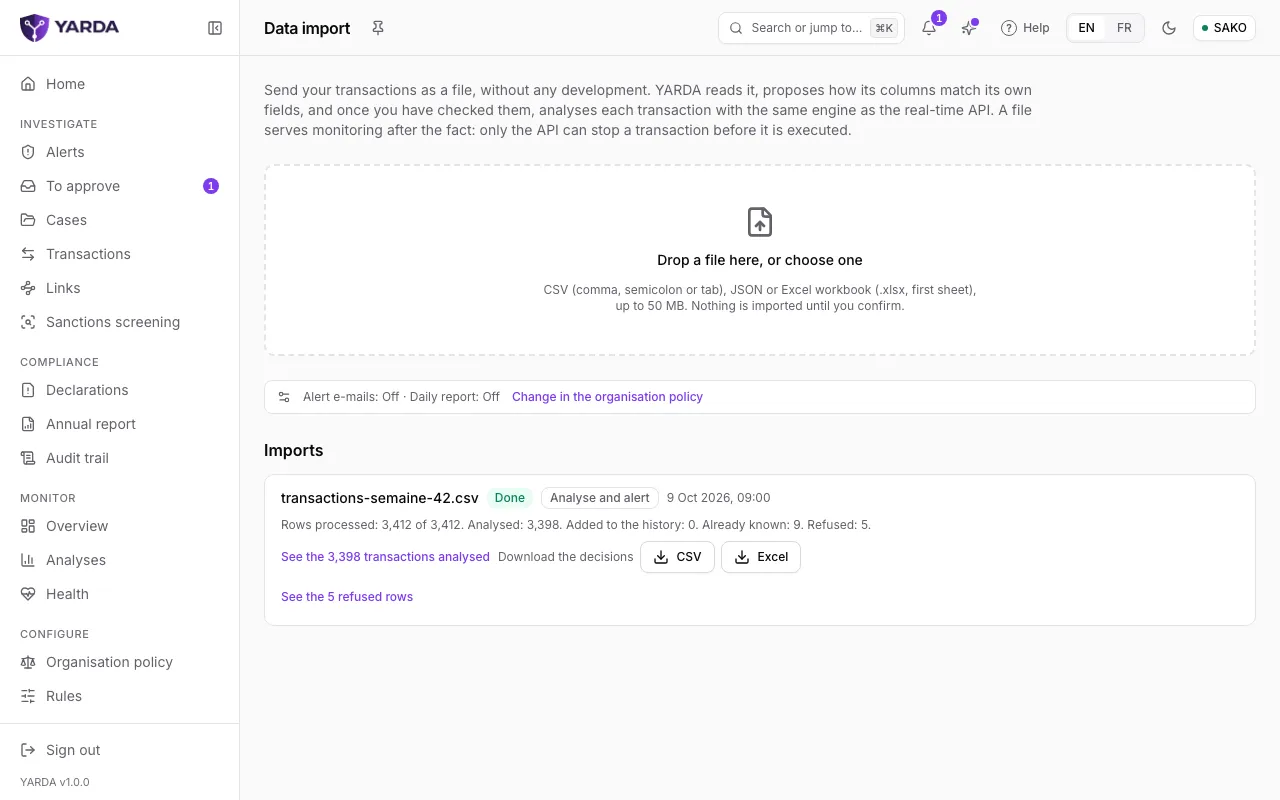
“Data import” is in the Connect section of the admins’ menu; analysts and supervisors open it through the search. Drop a CSV file (comma, semicolon or tab), JSON or an Excel workbook (first sheet), up to 50 MB. Nothing is imported before you confirm.
- “What to do with these transactions”: “Analyse and alert” for recent transactions, scored and sent to the alert queue; “Add to the history” for past transactions, kept without scoring to learn your customers’ usual behaviour.
- “Match the columns”: YARDA proposes a column of the file for each field it recognises. Check them one by one, with the example from the first row; required fields are marked.
- “How the file writes dates”: when the first rows do not tell the day from the month, choose the format yourself.
- For a history, “Assess the file” reads it whole without importing anything: usable and refused rows, duplicates, the period covered, the share of rows filling each field of your type of activity, the model features the file feeds, and whether a first model can learn from it (5,000 transactions in its last 90 days, every day of the week present). Changing the mapping or the date format asks for a new assessment.
- Start with “Analyse the transactions” or, after the assessment, “Add to the history”. “Discard this file” sets it aside without importing anything.
The “Imports” section follows each file: its state, the rows processed, scored, added to the history, already known and refused. From there, “See the transactions analysed”, “Download the decisions” as CSV or Excel, and the refused rows with their reason. A file left halfway through its check picks up again with “Resume”.
Having a view of your database read
Your technical team creates a view of your transactions and an account that can only read it. YARDA’s team then sets the connector up with you: the database’s address, the account, the column that orders the rows, the column mapping and how often to read, from every minute to once a day. The password is encrypted and never shown again.
The connector reads PostgreSQL, MySQL and SQL Server databases. YARDA’s account must only be able to read the view: for SQL Server, which has no read-only session, an account that is only a member of db_datareader or, better, limited to SELECT on the view; YARDA refuses an account that can write in the database or in the view’s schema, or change the view itself, and names each right to revoke. Its reads appear in “Imports”, marked “Database”, and the “Health” page flags a feed that stays silent.
Connecting the API
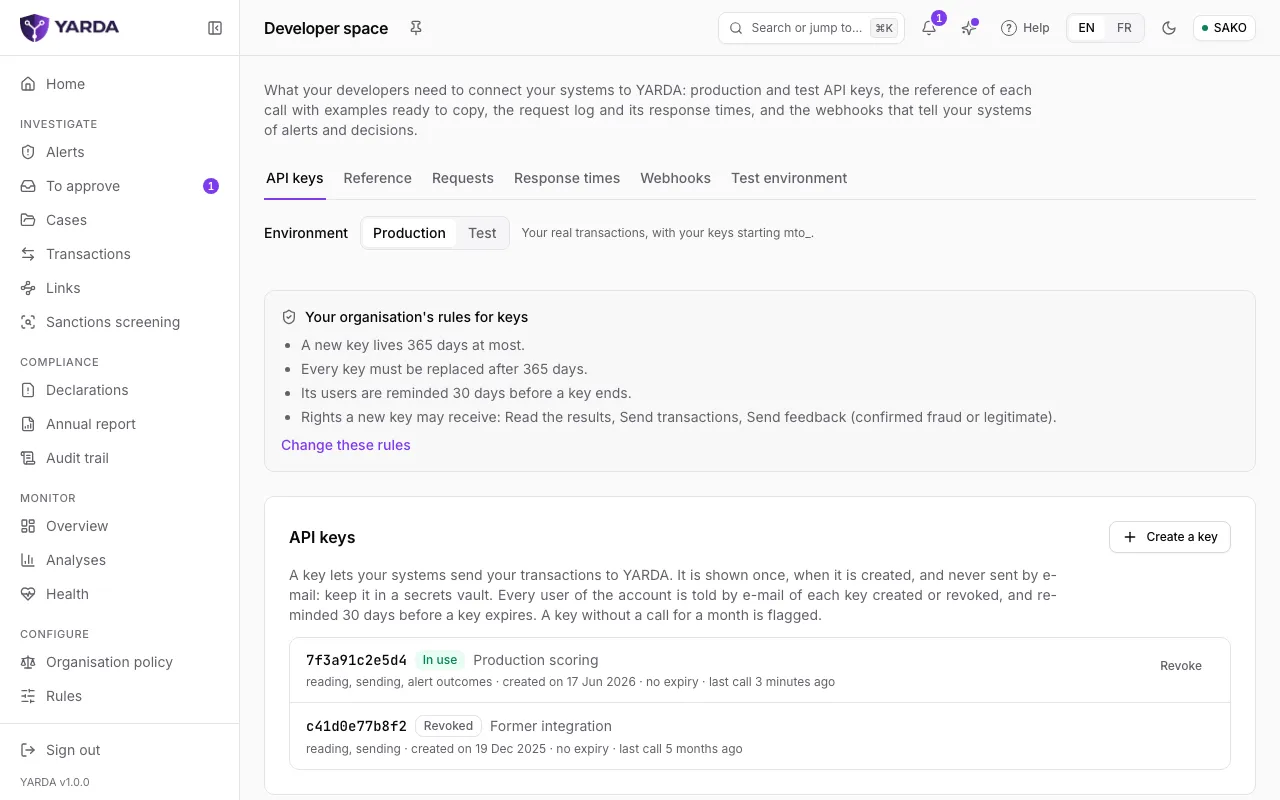
The “Developers” space, under Connect, holds what your developers need: “API keys”, “Reference”, “Requests”, “Response times”, “Webhooks” and “Test environment”. The client admin manages the keys there; your policy may open the logs to supervisors.
- “Create a key”, in production (keys starting with mto_) or in test (mto_test_). The key is shown only once, when it is created, and is never sent by email: keep it in a secrets vault. The account’s users are told of every key created or revoked.
- “Requests” lists the calls made with your keys: method, route, response, time spent in the API and request identifier, never their content.
- “Webhooks”: “Add an endpoint” so that YARDA tells your system of alerts, decisions and legal holds (placed, released, confirmed), with a delivery signed by a secret of each endpoint’s own. “Renew the secret” lets the old one keep signing during the switch.
- “Test environment”: fictitious transfers from the WAEMU over 90 days, to try your calls without ever touching your production.
Every call, its fields and its responses are described in the API reference, published on this site.
Following your go-live
For the client admin, “Getting started” shows the seven steps to full service: client profile, people using the console, a way to send transactions, history to learn from, a model in service, thresholds for your traffic, first transactions analysed. Each step is read from the data, never ticked by hand. As soon as the imported history is enough, the first model trains on its own, its critical typologies replayed, then enters observation: it scores beside the rules without deciding anything, and its training data serves as the data contract. A person puts it in service from the Models page, in view of its measurements. The entry leaves the menu once every step is done, and stays reachable through the search. Below the steps, “Data to send” lists what your organisation sends with each transaction, by its type of institution and its analysis mode: each item is required, recommended or optional, with the share of your transactions of the last thirty days that carries it.
Screenshots taken on the fictitious demonstration data, on .