Signing in
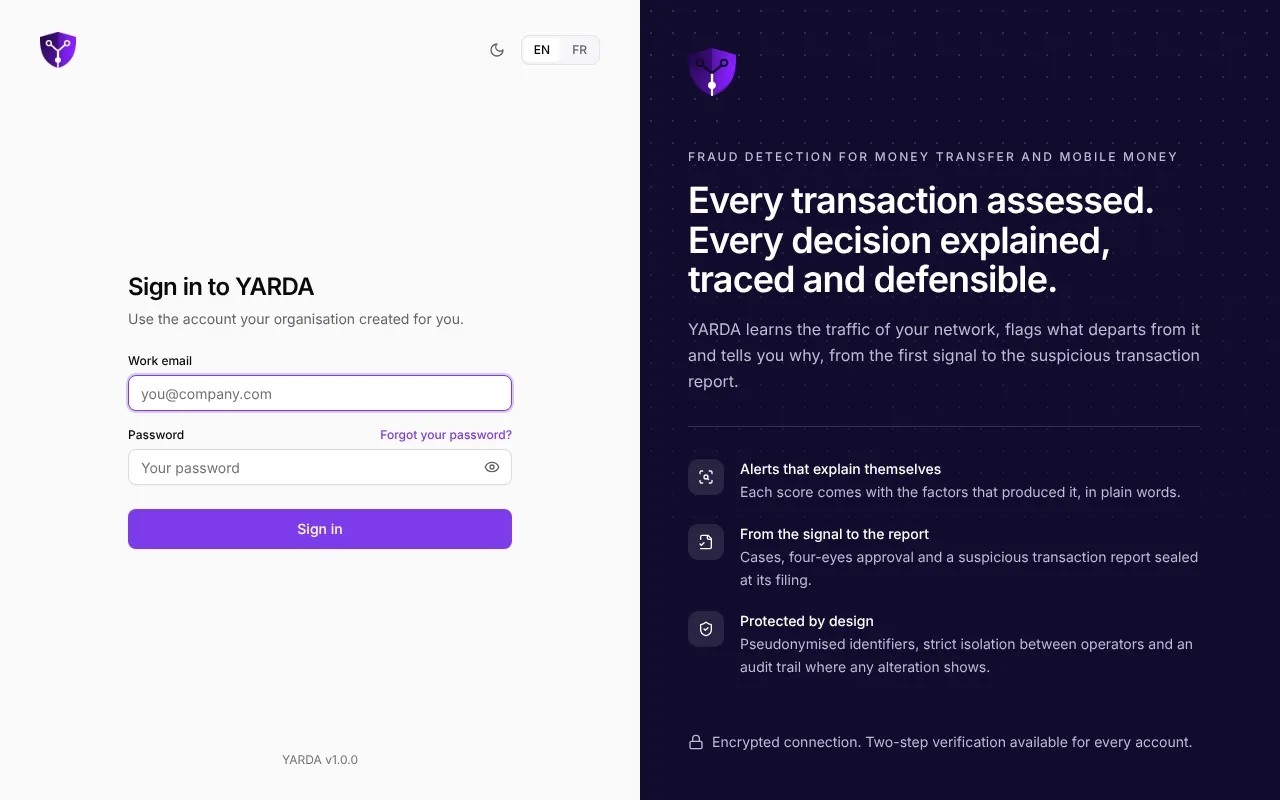
Your account is created by an administrator of your organisation. You receive an email with a link to choose your password: the link is valid for 48 hours. If it has expired, ask your administrator to send you a new link from the “Team” page.
- Open app.yarda.tech, enter your work email and your password, then choose “Sign in”.
- If two-step verification is on for your account, enter the code from your authenticator app, or a backup code with “Use a backup code instead”.
- If you have saved a passkey in your settings, “Sign in with a passkey” spares you the password.
Lost password: choose “Forgot your password?” on the sign-in page, enter your email and follow the link you receive.
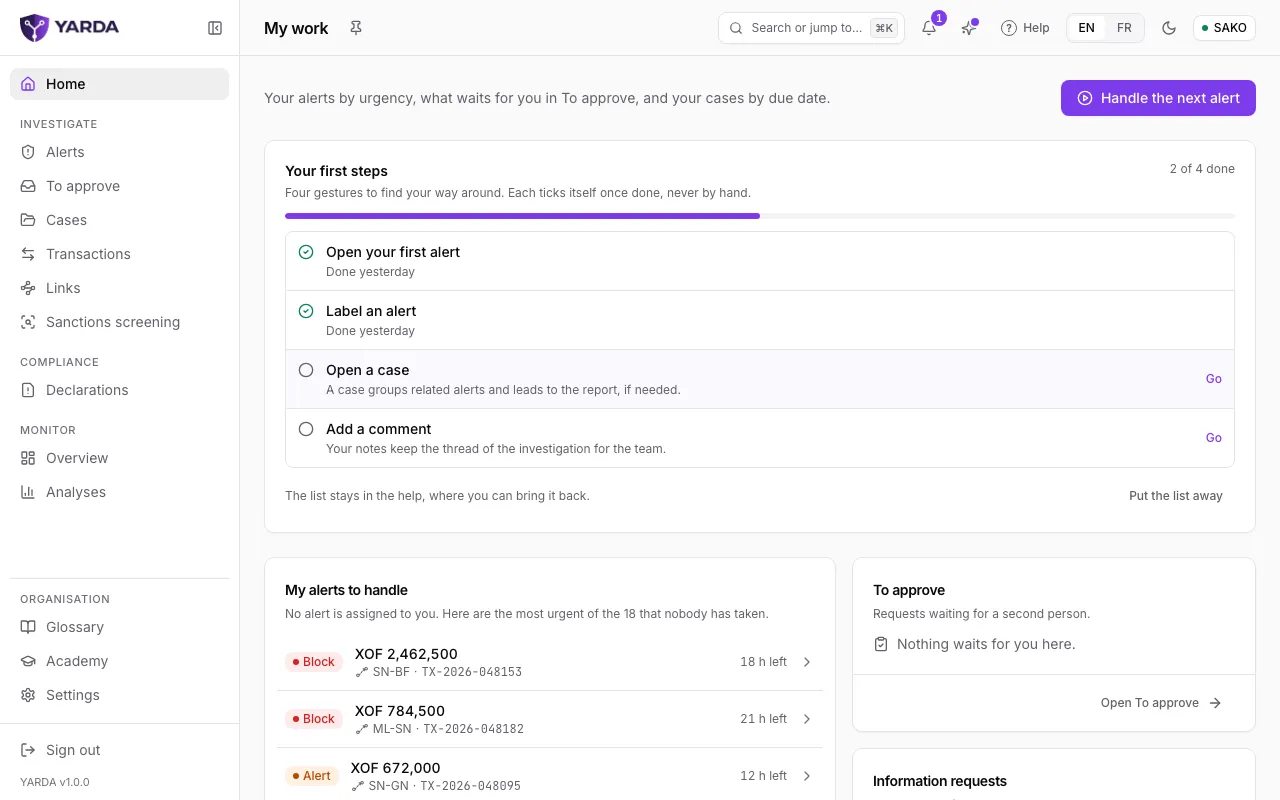
The menu, grouped by task
The menu on the left groups the pages by what you came to do, and shows only those your role works with. A page missing from your menu may still be reachable through the search, if your role may use it.
- Home: “My work”, what waits for you today, chosen for your role.
- Investigate: Alerts, To approve, Cases, Transactions, Links and Sanctions screening.
- Compliance: Declarations, Annual report, Audit trail and, when your policy turns them on, Requests of persons and Copilot log.
- Monitor: Overview, Analyses and Health.
- Configure: Organisation policy, Rules, Lists and Sandbox.
- Connect: Getting started (while a step remains), Data import and Developers.
- Organisation, at the foot of the menu: Team, the trust page, Glossary, Academy and Settings.
The home page, “My work”, changes with your role. Analysts find their alerts by urgency, what waits for them in “To approve”, their cases by due date, the requests for information to the customer to follow up when there are any, and the “Handle the next alert” button. Supervisors follow their team’s queue and delays, the approvals and reports waiting for them, and the health of the models and the data. Client admins also see the state of the feeds and of the go-live, the API keys that expire and YARDA’s requests for access. Read only, the home page shows the figures of the period and the reports. The overview of activity remains a page of its own, under Monitor.
While some remain, “Your first steps” show at the top of the home page: a few gestures for your role, which tick themselves once done, never by hand. “Put the list away” stores it in the help, where you can bring it back.
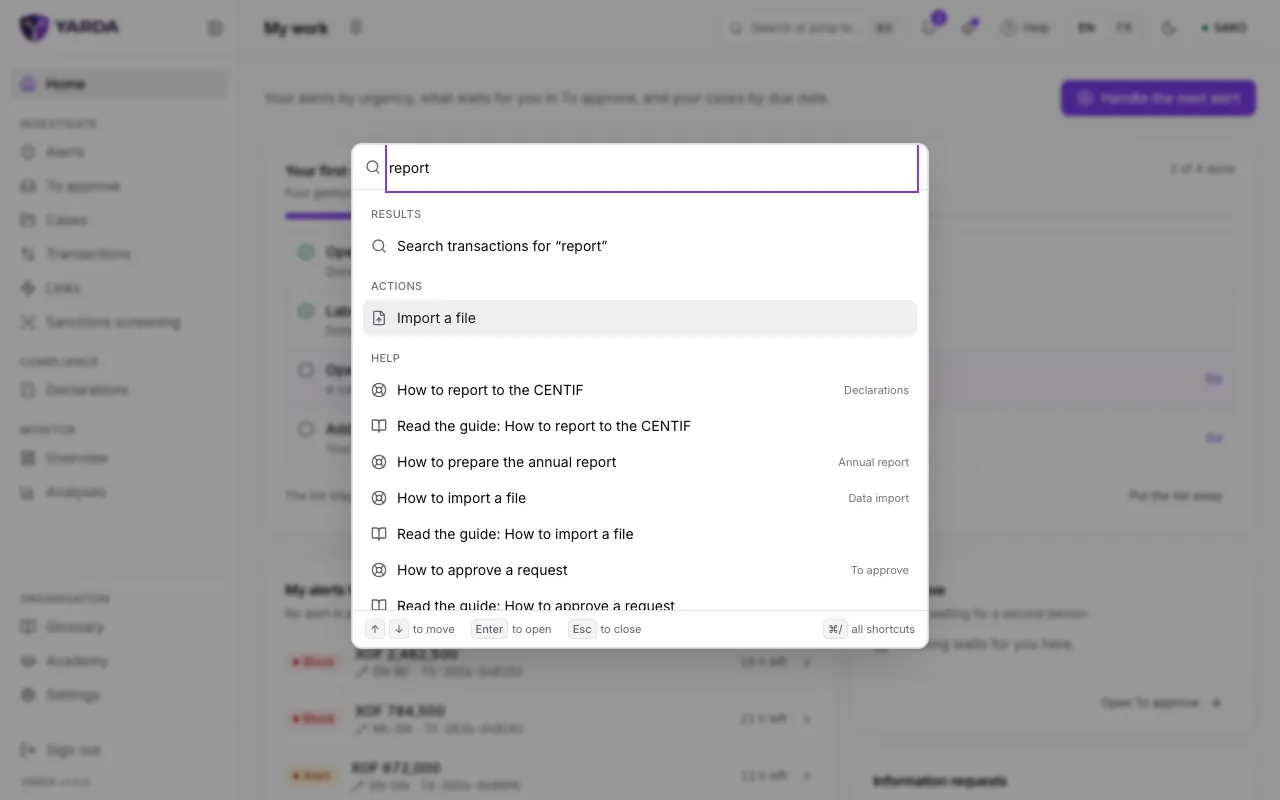
Reaching a page, an action or an answer
The “Search or jump to…” field, at the top of every page, also opens with Ctrl K, or Cmd K on a Mac. Type a few letters, then Enter.
- A page: the search lists every page your role may open, including those that are not in your menu.
- An action your role allows: “Handle the next alert”, “Open a case”, “Create a rule”, “Import a file” or “Invite a member”.
- The reference of a case (CAS-0007) or of a transaction, to reach it directly.
- A question, such as “how to report”: the console answers with the page where it is done, and offers the guide of this help centre that explains it.
Ctrl / (Cmd / on a Mac) shows every keyboard shortcut of the console.
The pin next to a page’s title puts it at the top of your menu. Your pinned pages, in the order you choose, are in “Settings”.
The header of every page
- The period (24h, 7d, 30d, 90d), on the pages that count activity.
- The notifications bell, with the number of unread notifications.
- “What’s new”: the latest improvements of the console, newest first.
- “Help”, or the ? key, which opens the help of the page.
- EN and FR to change language, and the light or dark theme button.
The help opens at the side, without leaving the page. It says what the page is for, its key gestures for your role and the terms it uses, with their definitions, then points to the guide of this help centre that tells the whole task. Its search looks through the glossary and the pages you can open.
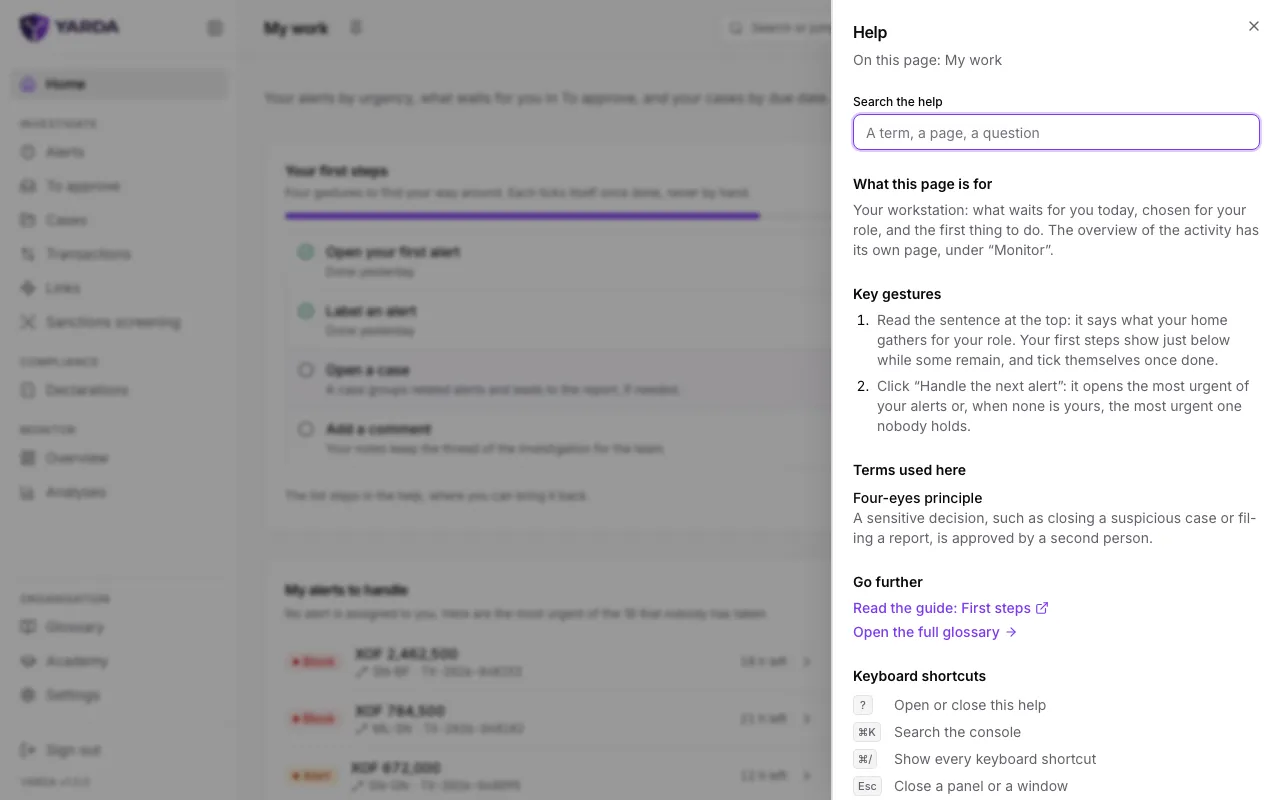
At the foot of the help, “Was this help useful?” collects your opinion, and “Contact YARDA” sends a request to the support. The page you are on, the version of the console and your role are attached, and you see them before sending; never any transaction data.
A term you do not know? The “Glossary” page, under Organisation, defines the AML/CFT terms of the WAEMU met in the console and what each indicator counts.
Training, and being guided
The “Academy”, under Organisation, offers short modules on your trade, five to ten minutes each: reading an alert and its reasons, recognising the eight typologies, working a case, reporting to the CENTIF, four-eyes approval, retention duties, privacy and pseudonymisation. Those of your role come first. Each module ends with a quiz; once passed, you get a dated attestation, which your organisation’s administrator finds in the “Team follow-up”.
Two guided tours, of four steps each, are offered to you once only: at your first suspicious transaction report and at your first change of the policy. “Skip the tour” stops it at any time, the page’s “Guided tour” button plays it again on request, and “Settings” lets you stop them being offered.
Setting the console up the way you like
In “Settings”, the “Profile” section keeps your name and your time zone: the console shows its dates in that zone. You also choose the language there, and under “Console preferences” the table density, the page the console opens on after sign-in and your pinned pages. These preferences follow your account on every device.
The “This device” section offers the data saver, useful on a slow connection: that choice stays on the device, not on your account.
Screenshots taken on the fictitious demonstration data, on .